

Wednesday, 21 December 2016
Modelling of up to three different pests with Trapview Degree Days
The Degree Days functionality has been a popular feature of Trapview to complement the automated pest monitoring information. Following user feedback and market demand we have extended the functionality and introduced degree day modelling for up to three different pests simultaneously. We are using the occasion to give a quick overview about the method and how to use it in Trapview application.
Degree days modelling is a methodology to assess pest insect development stage based on heat accumulation. Insects are exothermic or cold-blooded, therefore their body temperature and growth are fundamentally affected by temperature in their environment. They require a certain amount of heat accumulation to reach certain developmental stages, such as egg hatching, pupating or adult flight. For example Codling moth requires around 250 Degree Days (DD) to begin egg hatch and around 350-600 DD to reach peak flight of the first generation.

If Trapview automated traps are equipped with temperature and humidity sensor like pictured above, the basic weather data (which are obviously a prerequisite for the degree days methodology) are automatically collected. Combined with other pest monitoring information and imagery Trapview allows for better identification of the pest’s developmental stage and to more accurately plan appropriate crop protection measures.
In order to use the degree days model within Trapview WEB application a few parameters should be set by the user initially. The first parameter is the date of the start of monitoring season or the date of when the first insects were captured/observed in the trap (so called biofix). The next parameters are Lower development threshold (LDT) and Upper development threshold (UDT). Below the LDT and above UDT development of insects is rapidly slowed or does not occur. The threshold values depend on particular insect species and also on monitoring location. Default values are provided in the Trapview application based on accessible information available. However, the thresholds can be modified based on actual pest development and saved to be used for the following seasons.

Degree days modelling in Trapview is also a convenient way to lower the cost of monitoring different pests simultaneously. Trapview WEB application allows users to set degree days models for up to three different pests per single trap. The feature can be accessed by following the link Select additional monitored pest in the Degree days tab (please see the picture above).
Degree days modelling is a methodology to assess pest insect development stage based on heat accumulation. Insects are exothermic or cold-blooded, therefore their body temperature and growth are fundamentally affected by temperature in their environment. They require a certain amount of heat accumulation to reach certain developmental stages, such as egg hatching, pupating or adult flight. For example Codling moth requires around 250 Degree Days (DD) to begin egg hatch and around 350-600 DD to reach peak flight of the first generation.

In order to use the degree days model within Trapview WEB application a few parameters should be set by the user initially. The first parameter is the date of the start of monitoring season or the date of when the first insects were captured/observed in the trap (so called biofix). The next parameters are Lower development threshold (LDT) and Upper development threshold (UDT). Below the LDT and above UDT development of insects is rapidly slowed or does not occur. The threshold values depend on particular insect species and also on monitoring location. Default values are provided in the Trapview application based on accessible information available. However, the thresholds can be modified based on actual pest development and saved to be used for the following seasons.

Degree days modelling in Trapview is also a convenient way to lower the cost of monitoring different pests simultaneously. Trapview WEB application allows users to set degree days models for up to three different pests per single trap. The feature can be accessed by following the link Select additional monitored pest in the Degree days tab (please see the picture above).
Thursday, 24 November 2016
Helicoverpa armigera - The hungry traveler
Helicoverpa armigera (aka Old world bollworm / scarce bordered straw worm / corn earworm / cotton bollworm / cotton earworm / tobacco budworm / tomato worm) is a polyphagous and adaptive pest that attacks numerous crops like tomato, lettuce, soy, cotton, maize, common beans, chick peas, flax, sunflower, winter grains, citrus, wheat, barley, oats and sorghum. Worldwide, H. armigera has been reported on over 180 cultivated hosts and wild species in at least 45 plant families.

Its annual agricultural control costs and production losses amount to €5 billion globally. It is especially damaging because it feeds on the reproductive structures and bores inside the plant, making it difficult to detect and control. A very large number of insecticides are deployed to control this pest, which is already resistant to many compounds.
Get Full Article about H. armigera
Under adverse conditions, moths can migrate long distances. Adults can disperse distances of 10 km during “non-migratory flights” and hundreds of kilometres (up to 250 km) when making “migratory flights,” which occur when host quality or availability declines. Long-distance seasonal movements from low to higher latitudes, usually with warm winds preceding cold fronts, are most common in summer, and adults may migrate up to 1000km and reach Britain and other parts of Europe from sources in southern Europe and North Africa.

Because of its economical importance and distant migrations Trapview has initiated a 2-year project to create a dense network of fully automated traps in the Mediterranean basin, combining it with significant advances in automated pest recognition, data analysis and forecasting of pest population similar to weather forecasts. The project has been awarded a substantial grant from the EU Horizon 2020 SME Instrument programme, which is a direct recognition by EU Commission that EFOS' Trapview automated pest monitoring system is a breakthrough innovation in agriculture. The recognition allows EFOS to further position itself as a top leading crop and pest monitoring solution in the world.

Tuesday, 18 October 2016
Can we still improve quality control after 500+ years of experience?
This year Bavaria celebrates 500 years of one of the first laws regulating food safety and quality. Although roots can be dated back as early as 1400s’, in 1516 a series of orders were imposed in Bavaria and later in whole Germany called “Reinheitsgebot” – the Purity Law. According to it, the only ingredients that could be used in the production of beer were water, barley and hops.
The latter was initially used as a preservative as it adds to beer stability by virtue of its antibacterial properties, but it soon became fundamental to achieve desirable flavor and accent in beer. Depending on the style of beer, hops can add balance to the finished product through bitterness, flavor, and aroma, which is given by essential oils produced in the female flower of the hop plant[1].

Because many factors affect essential oil production and preservation, every season holds the potential for significant variation in both the total amount of oil and its composition, even for a single variety. Apart from soil quality and irrigation other major factors affecting hops quality are of course pests and diseases causing stress on plants and consequently reducing quantity and quality of yield (alfa acid and essential oil levels). Therefore, it is important that each of the plant distress factors are being controlled as much as possible.
With Slovenia being the 5th largest hops producing country in the World, the importance of controlling the inhibiting factors is that more articulated. Therefore the Slovenian Institute for Hop Research and Brewing (SIHRB) was established by Slovenian hop growers in 1952. Over a span of more than fifty years it has carried out a significant scientific research work in the area of hop growing and the brewing industry. Some of the areas of SIHRB’s activities are creation of new hop varieties, development new methods in technologies of hop production, implementation IPM (integrate pest management) in hop production and development of new hops production and harvesting technologies.

SIHBR conducts research on integrated pest and disease management methods for hops. Lately, one of the major insect pests in hops in Slovenia is European corn borer (Ostrinia nubilalis (ECB)) last ten years. Its presence on hops in Slovenia has been monitored by SIHBR for over 35 years and the economic damage it causes has been increasing significantly over the last 10 years[2]. One of the major challenges in monitoring ECB, according to dr. Rak Cizej, is that monitoring of ECB with pheromone-baited traps cannot yet be used in practice in prognosis system for forecasting.

Being aware of the problem of monitoring ECB also in other crops where it is present (primarily maize), Trapview has been cooperating with SIHRB in developing the automated light trap using special LED UV light to attract this elusive pest. The aim of Trapview automated pest monitoring system is to make the crop protection decision process simpler and easier for all stakeholders (forecasters, advisory staffs, farmers). The decision makers can base their actions on actual pest data sent from the automated traps placed in the field and processed by Trapview advanced image recognition, machine learning and data analysis algorithms that enable better crop quality control.
So this is how after 5 centuries of our ancestors’ endeavors SIHRB and Trapview are making joint efforts to make your next beer taste that much better.*
[1] http://www.morebeer.com/brewingtechniques/library/backissues/issue2.1/tinseth.html
[2] Cizej, M.R. 2013. Monitoring of the European corn borer (Ostrinia nubilalis Hübner) on hops (Humulus lupulus L.) with pheromone traps. Hop Bulletin, Vol.20 pp.38-47 ref.14.
*Drinking alcohol may harm your health. Drink responsibly.
[2] Cizej, M.R. 2013. Monitoring of the European corn borer (Ostrinia nubilalis Hübner) on hops (Humulus lupulus L.) with pheromone traps. Hop Bulletin, Vol.20 pp.38-47 ref.14.
*Drinking alcohol may harm your health. Drink responsibly.
Friday, 1 July 2016
Trapview Alerts
|


Thursday, 23 June 2016
Is pest population declining or is sticky plate full?
Assessing peak flight of the target pest species is one of the key tasks in insect monitoring when taking the crop protection measures. You miss a few days and effectiveness of the crop protection products could be reduced by even 40%.
With Trapview the users can assess the peak flight by following statistical data provided under the Pest chart tab like it is shown in the picture below. There is a curve clearly visible indicating that the peak flight has been reached. But is this really the case here?

If we take a closer look at the timeline of daily images, it is evident that there has been no sticky surface available for new pests to be caught for a few days now, which could mistakenly lead the users to think the peak flight was already reached. The consequence of this is misapplication of insecticides and risking development of resistance to insecticide in pests.

To ensure consistent trapping results and avoid risking insecticide misapplication, make sure enough sticky surface is always available for new pests to be caught efficiently. Therefore, sticky pads need to be changed regularly or as soon the gluing surface is covered with wing dust, dirt or other debris. So whenever you see a similar picture to the one below, make sure the sticky pad is changed as quickly as possible and mark this event in the Event tab.

Wednesday, 16 March 2016
7 Steps for successful start of the new monitoring season
As the preparations for the new growing season in the Northern Hemisphere are well under way, it is a good opportunity to remind you of a few simple steps to get the TRAPVIEW automated traps going and ready for the season.
Step 1
Visually inspect the trap and electronics housing, cables and solar cell for any damages or signs of wear and weather fatigue. If you need a new trap housing, please contact your TRAPVIEW supplier or write us an email.
Step 2
Prior turning the trap on for the season charge it by connecting the trap to the computer via mini USB – USB cable for 12 hours. In order to do that you need to remove the glass cover (use a screwdriver to remove it gently).
You can also put the trap and its solar cell in the sunlight for a day or two.
Step 3
Make sure your mobile data SIM card is active and sending data. You can test it simply by requesting the telemetry data with the following procedure:
• Turn the device ON (ON/OFF switch). Be sure that no lights are blinking – in case they are, reset the trap: turn it OFF and then ON again.
• Hold the “POWER” button for a few seconds:

- If you hold the “POWER” button till all the led diodes light up, the device will start taking a photo in few minutes (each camera takes its own photo separately, so it will take 4 photos).
- If you release the POWER button after the first or first two rows of the led diodes light up, it will send a telemetry in few minutes.
In both cases you will see the “OPERATE” light blinking – it shows that the device is operating. In the web application you will see a circulating icon - it shows that the trap is sending data.
Count that it takes a little bit longer to see the picture (telemetry) sent in the Trapview WEB application. In some cases it can take almost an hour.
If you do not get any data after 24 hours, please reactivate your mobile data SIM card by contacting your mobile operator or our support, if we have supplied you with the SIM card.
Step 4
Clean the glass cover in order to get the best images and screw it back onto the device.
Step 5
Replenish your stock of sticky plates, pheromone lures and external trap housings if needed.
Step 6
Place the trap in the field/orchard. Make sure the solar panel is facing the south and that it is getting direct sunlight, not shadowed by vegetation, tree canopy or any other objects.
Step 7
After placing the traps in the field/orchard, make sure you properly set the new growing season and their new locations (if necessary) in the Trapview WEB application.
The start of new season can be set by clicking the cogwheel at the right most in the list of traps (home menu) and then choosing Start new season.

Select the starting date of the new season, select a location where the trap is located and the pest you are going to monitor with the trap.
Please note that location is not to be mistaken for GPS position. Location is the name of the spot (or field, orchard, greenhouse, etc.) where the trap is placed and serves as a reference point for keeping historical data through several seasons. Since different traps can be exchanged between different locations from season to season, it is necessary that the historical data is kept for each location, not for each trap.
You can set and define the location either by clicking the the cogwheel at the right most in the list of traps (home menu) and then choose Change location or clicking word Undefined by the name of the trap. When setting the location, you also need to define the validity or better the period of time that trap is placed at that location.
If you need any assistance with the installation or setup steps described above, please refer to the instruction manuals that were supplied together with the trap, our video unboxing Trapview, the help menu in the Trapview WEB application or contact the Trapview support.
Step 1
Visually inspect the trap and electronics housing, cables and solar cell for any damages or signs of wear and weather fatigue. If you need a new trap housing, please contact your TRAPVIEW supplier or write us an email.
Step 2
Prior turning the trap on for the season charge it by connecting the trap to the computer via mini USB – USB cable for 12 hours. In order to do that you need to remove the glass cover (use a screwdriver to remove it gently).
You can also put the trap and its solar cell in the sunlight for a day or two.
Step 3
Make sure your mobile data SIM card is active and sending data. You can test it simply by requesting the telemetry data with the following procedure:
• Turn the device ON (ON/OFF switch). Be sure that no lights are blinking – in case they are, reset the trap: turn it OFF and then ON again.
• Hold the “POWER” button for a few seconds:
- If you hold the “POWER” button till all the led diodes light up, the device will start taking a photo in few minutes (each camera takes its own photo separately, so it will take 4 photos).
- If you release the POWER button after the first or first two rows of the led diodes light up, it will send a telemetry in few minutes.
In both cases you will see the “OPERATE” light blinking – it shows that the device is operating. In the web application you will see a circulating icon - it shows that the trap is sending data.
Count that it takes a little bit longer to see the picture (telemetry) sent in the Trapview WEB application. In some cases it can take almost an hour.
If you do not get any data after 24 hours, please reactivate your mobile data SIM card by contacting your mobile operator or our support, if we have supplied you with the SIM card.
Step 4
Clean the glass cover in order to get the best images and screw it back onto the device.
Step 5
Replenish your stock of sticky plates, pheromone lures and external trap housings if needed.
Step 6
Place the trap in the field/orchard. Make sure the solar panel is facing the south and that it is getting direct sunlight, not shadowed by vegetation, tree canopy or any other objects.
Step 7
After placing the traps in the field/orchard, make sure you properly set the new growing season and their new locations (if necessary) in the Trapview WEB application.
The start of new season can be set by clicking the cogwheel at the right most in the list of traps (home menu) and then choosing Start new season.

Select the starting date of the new season, select a location where the trap is located and the pest you are going to monitor with the trap.
Please note that location is not to be mistaken for GPS position. Location is the name of the spot (or field, orchard, greenhouse, etc.) where the trap is placed and serves as a reference point for keeping historical data through several seasons. Since different traps can be exchanged between different locations from season to season, it is necessary that the historical data is kept for each location, not for each trap.
You can set and define the location either by clicking the the cogwheel at the right most in the list of traps (home menu) and then choose Change location or clicking word Undefined by the name of the trap. When setting the location, you also need to define the validity or better the period of time that trap is placed at that location.
If you need any assistance with the installation or setup steps described above, please refer to the instruction manuals that were supplied together with the trap, our video unboxing Trapview, the help menu in the Trapview WEB application or contact the Trapview support.
Thursday, 18 February 2016
Improve your methods by logging pest control events in Trapview
In this month’s post we are going to show you how you can make most out of the Events tab feature in our Trapview WEB application and why it is important to log your pest control activities.

By logging the events such as change of sticky plate, change of lure (pheromone) and spraying, you are able to get much clearer picture on what was going on during the season and which measures were taken at what moment.

In Trapview WEB application the spraying events are shown against the pest occurrence data on the Pest chart and one can easily see whether the measures taken produced the desired effects or not.

Furthermore, logging events makes post-season analysis and pre-season preparations more intelligent. Continuous historical data stretching over several seasons enables a critical insight in the dynamics of pests in connection to insect control activities and thus provides a great basis for applying best practices consistently over the years.
Note: Please make sure the trap location is set before you start logging events for a given trap. Please refer to the instruction manual or help menu in Trapview WEB application.
Wednesday, 13 January 2016
Collecting more pest monitoring data with Trapview MOBILE
Trapview Automated pest monitoring system provides an early warning platform by utilizing automated traps that regularly send data to the Trapview cloud. There further advanced functionalities such as automated pest recognition, manual review of the pictures taken automatically and pest occurrence statistics are provided.
In the fields/orchards where matrix monitoring concept is being implemented the consequent effort to increase the number of monitoring points (traps per acre) leads to the Trapview automated traps being combined with conventional traps. This results in a need for a tool that allows the end users to gather data manually and keep all pest monitoring data in one place together with the data from the Trapview automated traps.
Therefore, the Trapview MOBILE application was introduced to enable users to take pictures of sticky plates of the conventional - “manual” - traps, to add the data about numbers of the insects caught on the sticky plates and to upload all the data to the Trapview system, where it is shown next to the data collected from automated traps.
What's special about the Trapview MOBILE application
What makes the Trapview MOBILE application different from the conventional scouting apps is that apart from enabling the users to enter pest related data from manual traps the users also get an overview and management options of their Trapview automated traps together with detailed pest occurrence charts and statistics.
Overview and management of the Trapview automated traps
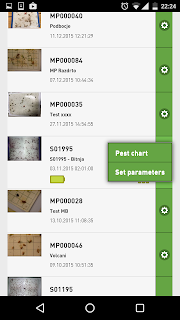
After login to the application the main screen with an interactive map shows up. It displays the locations of user's automated traps marked with the trap icon and the manual monitoring points marked with the mobile phone icon. Below the map there is a device list displaying traps and mobile monitoring points with the thumbnails of the last uploaded images from the trap or mobile phone.

By choosing a particular automated trap (the name starts with Sxxxxx) the last uploaded automatically captured image shows. You can browse the previously taken images by swiping to the left or to the right.

By pressing on a cogwheel icon by the name of an automated trap in the main screen device list a menu shows up providing two options: Pest chart and Set parameters
Pest chart
By pressing the Pest chart option, the users get an overview of the pest occurrences over a selected period (7 days by default) per day and total number of new pests in that period. The bars in the pest chart show the number of pests detected on a particular day, while the red curve is showing the difference in number and dynamics of pest occurrences per day.
Below the pest chart there is a Pest table showing in numbers what is shown in bars in the Pest chart above it. The users can choose which columns should be displayed in the table depending on what they would like to see.


Setting parameters of an automated trap
By pressing on a Set parameters option a dialog screen shows different options for setting the parameters of the selected automated trap:


The image capture time setting is especially useful for synchronizing the monitoring timings with the time of the day when the targeted pest is most active.
How to input data from a manual monitoring point
Pressing the cogwheel icon by the mobile monitoring point (the name starts with MPxxx) in the main screen the option of Upload image shows. By choosing it a dialog screen shows providing the options of taking a picture at the very location (the button with the camera icon) or uploading the picture from the gallery (the button with the picture icon). Below, there is also a field for entering the number of pests counted at the monitoring point and additional space for taking notes. When finished users need to press the Upload button to send the data to the Trapview system, where users can access it and manage it in the Trapview WEB application on their PC.


Setting a new manual monitoring point
While in the field you can also set a new monitoring point on the go. Simply by pressing the Actions button on the top right of the main screen a New monitoring point option shows up. All users need to do is enter the name of the monitoring point and they are done, since the geoposition is received automatically by the app.


The Trapview MOBILE application is a great monitoring tool not only allowing having all pest related data in one place, but also combining early warning system with standard monitoring methods and consequently providing even better decision support data input for optimized insecticide application.
In the fields/orchards where matrix monitoring concept is being implemented the consequent effort to increase the number of monitoring points (traps per acre) leads to the Trapview automated traps being combined with conventional traps. This results in a need for a tool that allows the end users to gather data manually and keep all pest monitoring data in one place together with the data from the Trapview automated traps.
Therefore, the Trapview MOBILE application was introduced to enable users to take pictures of sticky plates of the conventional - “manual” - traps, to add the data about numbers of the insects caught on the sticky plates and to upload all the data to the Trapview system, where it is shown next to the data collected from automated traps.
What's special about the Trapview MOBILE application
What makes the Trapview MOBILE application different from the conventional scouting apps is that apart from enabling the users to enter pest related data from manual traps the users also get an overview and management options of their Trapview automated traps together with detailed pest occurrence charts and statistics.
Overview and management of the Trapview automated traps
After login to the application the main screen with an interactive map shows up. It displays the locations of user's automated traps marked with the trap icon and the manual monitoring points marked with the mobile phone icon. Below the map there is a device list displaying traps and mobile monitoring points with the thumbnails of the last uploaded images from the trap or mobile phone.

By choosing a particular automated trap (the name starts with Sxxxxx) the last uploaded automatically captured image shows. You can browse the previously taken images by swiping to the left or to the right.

By pressing on a cogwheel icon by the name of an automated trap in the main screen device list a menu shows up providing two options: Pest chart and Set parameters

Pest chart
By pressing the Pest chart option, the users get an overview of the pest occurrences over a selected period (7 days by default) per day and total number of new pests in that period. The bars in the pest chart show the number of pests detected on a particular day, while the red curve is showing the difference in number and dynamics of pest occurrences per day.
Below the pest chart there is a Pest table showing in numbers what is shown in bars in the Pest chart above it. The users can choose which columns should be displayed in the table depending on what they would like to see.


Setting parameters of an automated trap
By pressing on a Set parameters option a dialog screen shows different options for setting the parameters of the selected automated trap:
- data network settings (e.g. SMS report numbers, network operator username and password, etc.),
- image capture time setting,
- telemetry report time setting,
- image compression ratio, etc.


The image capture time setting is especially useful for synchronizing the monitoring timings with the time of the day when the targeted pest is most active.
How to input data from a manual monitoring point
Pressing the cogwheel icon by the mobile monitoring point (the name starts with MPxxx) in the main screen the option of Upload image shows. By choosing it a dialog screen shows providing the options of taking a picture at the very location (the button with the camera icon) or uploading the picture from the gallery (the button with the picture icon). Below, there is also a field for entering the number of pests counted at the monitoring point and additional space for taking notes. When finished users need to press the Upload button to send the data to the Trapview system, where users can access it and manage it in the Trapview WEB application on their PC.


Setting a new manual monitoring point
While in the field you can also set a new monitoring point on the go. Simply by pressing the Actions button on the top right of the main screen a New monitoring point option shows up. All users need to do is enter the name of the monitoring point and they are done, since the geoposition is received automatically by the app.


The Trapview MOBILE application is a great monitoring tool not only allowing having all pest related data in one place, but also combining early warning system with standard monitoring methods and consequently providing even better decision support data input for optimized insecticide application.
Subscribe to:
Posts (Atom)