
Trapview Automated pest monitoring system provides an early warning platform by utilizing automated traps that regularly send data to the Trapview cloud. There further advanced functionalities such as automated pest recognition, manual review of the pictures taken automatically and pest occurrence statistics are provided.
In the fields/orchards where matrix monitoring concept is being implemented the consequent effort to increase the number of monitoring points (traps per acre) leads to the Trapview automated traps being combined with conventional traps. This results in a need for a tool that allows the end users to gather data manually and keep all pest monitoring data in one place together with the data from the Trapview automated traps.
Therefore, the Trapview MOBILE application was introduced to enable users to take pictures of sticky plates of the conventional - “manual” - traps, to add the data about numbers of the insects caught on the sticky plates and to upload all the data to the Trapview system, where it is shown next to the data collected from automated traps.
What's special about the Trapview MOBILE application
What makes the Trapview MOBILE application different from the conventional scouting apps is that apart from enabling the users to enter pest related data from manual traps the users also get an overview and management options of their Trapview automated traps together with detailed pest occurrence charts and statistics.
Overview and management of the Trapview automated traps
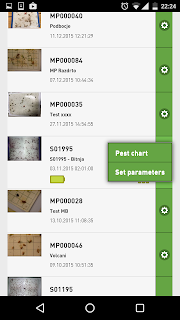
After login to the application the main screen with an interactive map shows up. It displays the locations of user's automated traps marked with the trap icon and the manual monitoring points marked with the mobile phone icon. Below the map there is a device list displaying traps and mobile monitoring points with the thumbnails of the last uploaded images from the trap or mobile phone.

By choosing a particular automated trap (the name starts with Sxxxxx) the last uploaded automatically captured image shows. You can browse the previously taken images by swiping to the left or to the right.

By pressing on a cogwheel icon by the name of an automated trap in the main screen device list a menu shows up providing two options: Pest chart and Set parameters
Pest chart
By pressing the Pest chart option, the users get an overview of the pest occurrences over a selected period (7 days by default) per day and total number of new pests in that period. The bars in the pest chart show the number of pests detected on a particular day, while the red curve is showing the difference in number and dynamics of pest occurrences per day.
Below the pest chart there is a Pest table showing in numbers what is shown in bars in the Pest chart above it. The users can choose which columns should be displayed in the table depending on what they would like to see.


Setting parameters of an automated trap
By pressing on a Set parameters option a dialog screen shows different options for setting the parameters of the selected automated trap:


The image capture time setting is especially useful for synchronizing the monitoring timings with the time of the day when the targeted pest is most active.
How to input data from a manual monitoring point
Pressing the cogwheel icon by the mobile monitoring point (the name starts with MPxxx) in the main screen the option of Upload image shows. By choosing it a dialog screen shows providing the options of taking a picture at the very location (the button with the camera icon) or uploading the picture from the gallery (the button with the picture icon). Below, there is also a field for entering the number of pests counted at the monitoring point and additional space for taking notes. When finished users need to press the Upload button to send the data to the Trapview system, where users can access it and manage it in the Trapview WEB application on their PC.


Setting a new manual monitoring point
While in the field you can also set a new monitoring point on the go. Simply by pressing the Actions button on the top right of the main screen a New monitoring point option shows up. All users need to do is enter the name of the monitoring point and they are done, since the geoposition is received automatically by the app.


The Trapview MOBILE application is a great monitoring tool not only allowing having all pest related data in one place, but also combining early warning system with standard monitoring methods and consequently providing even better decision support data input for optimized insecticide application.
In the fields/orchards where matrix monitoring concept is being implemented the consequent effort to increase the number of monitoring points (traps per acre) leads to the Trapview automated traps being combined with conventional traps. This results in a need for a tool that allows the end users to gather data manually and keep all pest monitoring data in one place together with the data from the Trapview automated traps.
Therefore, the Trapview MOBILE application was introduced to enable users to take pictures of sticky plates of the conventional - “manual” - traps, to add the data about numbers of the insects caught on the sticky plates and to upload all the data to the Trapview system, where it is shown next to the data collected from automated traps.
What's special about the Trapview MOBILE application
What makes the Trapview MOBILE application different from the conventional scouting apps is that apart from enabling the users to enter pest related data from manual traps the users also get an overview and management options of their Trapview automated traps together with detailed pest occurrence charts and statistics.
Overview and management of the Trapview automated traps
After login to the application the main screen with an interactive map shows up. It displays the locations of user's automated traps marked with the trap icon and the manual monitoring points marked with the mobile phone icon. Below the map there is a device list displaying traps and mobile monitoring points with the thumbnails of the last uploaded images from the trap or mobile phone.

By choosing a particular automated trap (the name starts with Sxxxxx) the last uploaded automatically captured image shows. You can browse the previously taken images by swiping to the left or to the right.

By pressing on a cogwheel icon by the name of an automated trap in the main screen device list a menu shows up providing two options: Pest chart and Set parameters

Pest chart
By pressing the Pest chart option, the users get an overview of the pest occurrences over a selected period (7 days by default) per day and total number of new pests in that period. The bars in the pest chart show the number of pests detected on a particular day, while the red curve is showing the difference in number and dynamics of pest occurrences per day.
Below the pest chart there is a Pest table showing in numbers what is shown in bars in the Pest chart above it. The users can choose which columns should be displayed in the table depending on what they would like to see.


Setting parameters of an automated trap
By pressing on a Set parameters option a dialog screen shows different options for setting the parameters of the selected automated trap:
- data network settings (e.g. SMS report numbers, network operator username and password, etc.),
- image capture time setting,
- telemetry report time setting,
- image compression ratio, etc.


The image capture time setting is especially useful for synchronizing the monitoring timings with the time of the day when the targeted pest is most active.
How to input data from a manual monitoring point
Pressing the cogwheel icon by the mobile monitoring point (the name starts with MPxxx) in the main screen the option of Upload image shows. By choosing it a dialog screen shows providing the options of taking a picture at the very location (the button with the camera icon) or uploading the picture from the gallery (the button with the picture icon). Below, there is also a field for entering the number of pests counted at the monitoring point and additional space for taking notes. When finished users need to press the Upload button to send the data to the Trapview system, where users can access it and manage it in the Trapview WEB application on their PC.


Setting a new manual monitoring point
While in the field you can also set a new monitoring point on the go. Simply by pressing the Actions button on the top right of the main screen a New monitoring point option shows up. All users need to do is enter the name of the monitoring point and they are done, since the geoposition is received automatically by the app.


The Trapview MOBILE application is a great monitoring tool not only allowing having all pest related data in one place, but also combining early warning system with standard monitoring methods and consequently providing even better decision support data input for optimized insecticide application.


 icon
icon
 : with a click onto the marking square you select it
 : select and click Duplicate Element icon (or press D key)


